Field Service Reporting and Analytics Software
Service Pro® Business Intelligence: Leverage the Power of Data to Win in Field Service
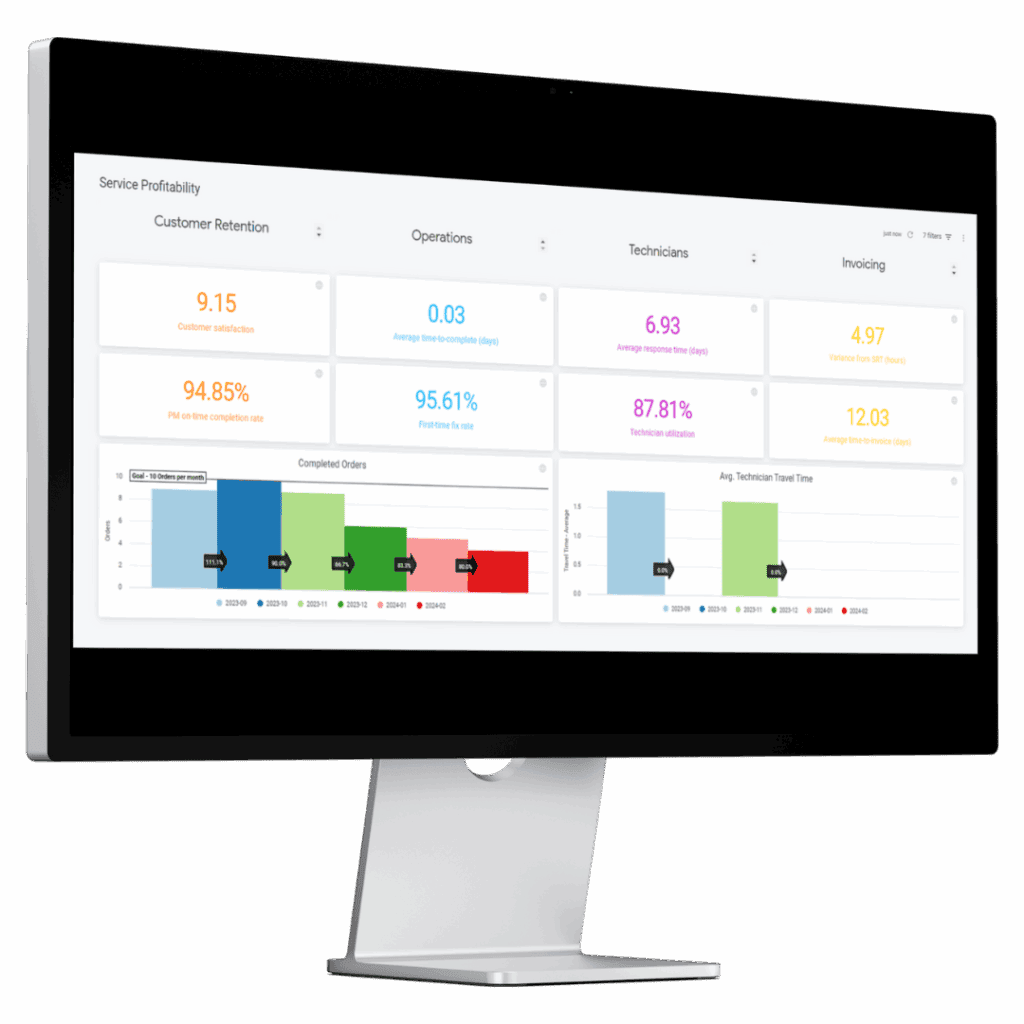
Gain deep insight into your field service operations
Are your service operations data rich but information poor? Then you may be losing out on potential business opportunities, greater technician efficiency, and higher service revenue.
Harness the power of data to achieve service excellence with Service Pro® Business Intelligence. With customizable, no-coding-required data visualization tools, you can track critical service KPIs, boost technician efficiency, and identify potential problems before they impact your customers, without the need for IT support.
Service Pro® Business Intelligence Features
-
Choose from 19 available visualization types, such as bar charts, funnel charts, pie charts, and more
-
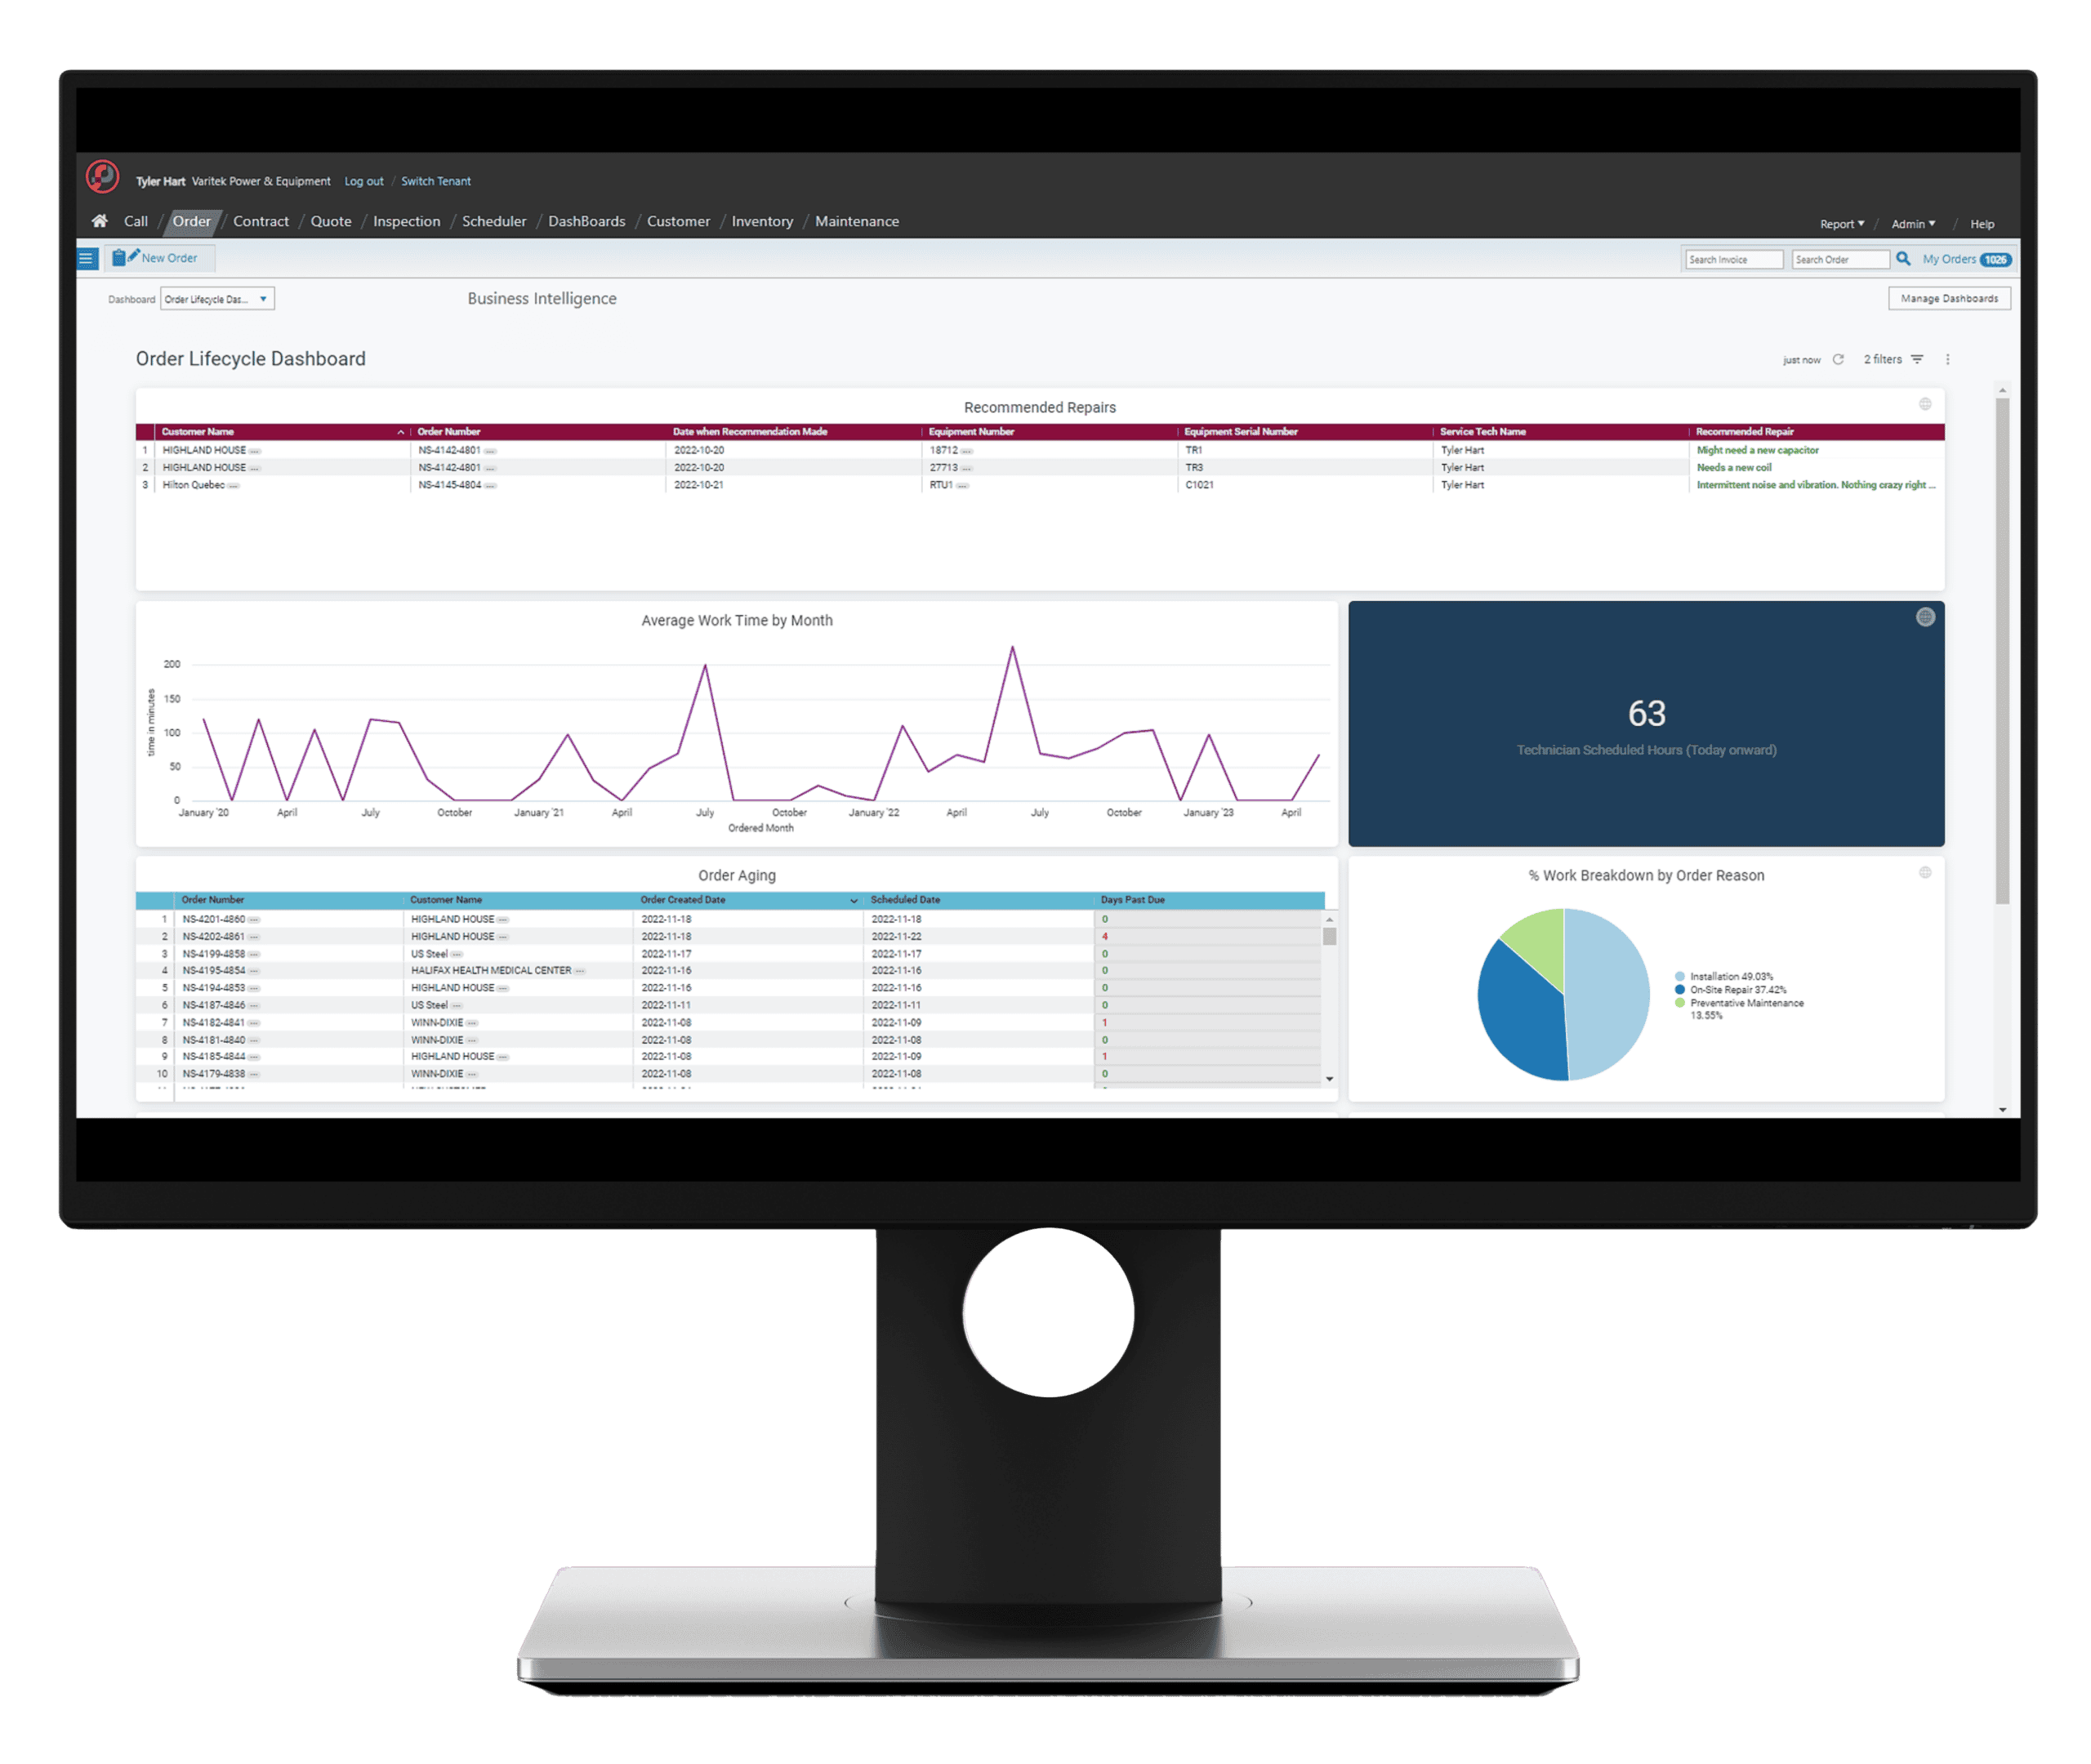
Create unlimited visualizations from critical data, including orders, appointments, labor, service contracts, inspections and equipment
-
Easily filter visualizations based on location, warehouse, and technician
-
Easily access data sets driving visualizations and view urgent orders directly from dashboards
-
Analyze individual technician performance
-
Download dashboards as PDF or CSV
Service Pro® parts and inventory software helps busy service organizations closely track warehouse and van parts inventory.
Frequently asked Questions
What is Field Service Reporting software?
Field Service Reporting software is an application that collects, analyzes, and presents operational data from field service activities. It is designed to transform complex data on labor, assets, contracts, and work orders into actionable information and deep insights for management.
What are the key features of Field Service Reporting software?
The key features of this software include:
Customizable Data Visualization: It allows users to create unlimited, no-coding-required visualizations, choosing from multiple types like bar charts, funnel charts, and pie charts.
KPI Tracking: It enables tracking of critical Service KPIs using data from orders, appointments, labor, service contracts, inspections, and equipment.
Technician Performance Analysis: It provides tools to easily analyze the performance of individual technicians and improve their efficiency.
Data Access and Filtering: Users can easily access the underlying data sets, filter visualizations based on location or technician, and view urgent orders directly from the dashboards.
What are the main benefits of using Field Service Reporting software?
The main benefits are achieving superior performance and making data-driven decisions:
Boosted Technician Efficiency: It provides the insights needed to improve technician performance and maximize service revenue.
Proactive Problem Identification: It allows the organization to identify potential problems and business opportunities before they impact customers.
Easy Accessibility: The tools are user-friendly, do not require IT support, and allow dashboards to be downloaded as PDF or CSV files for easy sharing.
Service Excellence: It ensures the organization moves from being “data rich but information poor” to achieving comprehensive service excellence.